
Here are two reasons why you should not read this blog article:
- It's about condition monitoring and predictive maintenance...
- ... and thus an absolute standard use case in machine learning. But we are pleased that they are still there...
And here are two arguments why you should perhaps read on first:
- In the machine tool industry, we are still a long way from using artificial intelligence...
- ... although the use of machine learning can save millions in this industry.
In a two-part blog article series, we show the possibilities of data evaluation and the use of machine learning in machining with CNC machines. We clarify how to get the data from the machines, how additional data can further increase the benefits and how this can save costs.
In the course of the MAI ILQ2020 research project Together with the BMW Group, we have Core Competence Centre Finance & Information Management at the University of Augsburg, the inno-focus businessconsulting gmbh and Hufschmied Zerspanungssysteme GmbH were examined, to what extent already during production (inline) quality control can take place and thus intervene before quality problems arise. Production technology and information technology are two areas that until recently mostly acted separately from each other and often had only a few interfaces. The constant digitalisation of production is bringing these areas closer and closer together. To obtain the greatest benefit, these areas must merge. This article helps both sides to understand each other, shows which interfaces exist and what opportunities arise when they work together.
Inhaltsverzeichnis
The way to the machine data
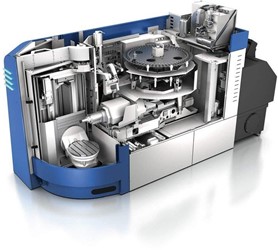
A machining centre (machining centre) is a CNC machine that supports at least two machining operations with automatic tool change (Fig. 1).
These machining centres, mainly built by large manufacturers such as DMG Mori and GROB-WERKEN, are operated with different control systems, whereby, according to a common Market study by MM Maschinenmarkt and the internet forum CNC Arena, the control manufacturers Heidenhain, Siemens and Fanuc have a share of about 80 % of the controls used for CNC machining.
The control system should adhere to the specified settings, such as speed or position of the spindle, as accurately as possible. A digital approach has been used here since the 1960s. This control produces unused control data that is neither used by the machine nor evaluated. But precisely this data already contains information about the quality of the components and the condition of the tool.
Fortunately, control system manufacturers are also slowly recognising this potential and offer systems that can simplify and automate the reading of data. GROB, for example, offers modules such as GROB4Line to read out the most important data and forward it directly to a cloud. Not only machine data is sent, but also information about the tools that have been changed, machine alarms and the NC program currently running. It should be noted that the sampling rate of GROb4Line is limited and, in contrast to a sampling rate of up to 500 Hz with SIEMENS Trace or TNCscope, can only be read out with an average sampling rate of 50 Hz.
For the following experiments, however, this sampling rate was already sufficient to gain knowledge. Since the main task of the machines is to keep to the specified parameters as accurately as possible and to calculate complex travel paths, the data transfer can be interrupted or throttled in order not to overload the machine's memory and processor. This creates the challenge of enabling a constant data stream.
In recent years, more and more control manufacturers have taken notice of the pressure from machine builders and new solutions for better data transmission are constantly being introduced. The path to data extraction is therefore under construction and soon so much data will be available that one wonders what to do with it and how the data can be processed in a meaningful way.
Quality control through data analysis
The most important component of the CNC machine is the spindle, which can always move relative to the component and, on the other hand, rotates at a mostly predefined spindle speed. The movement of the spindle is programmed by means of a machine code (NC code) and is usually based on the 3D models of the component to be machined.
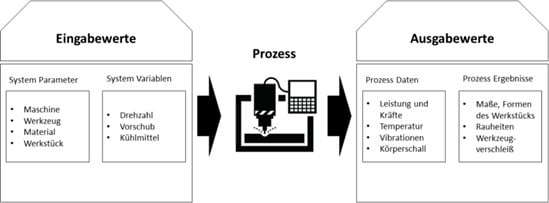
These system variables, together with the system parameters, form the input values that are given to the machine by the machine operator. As a result, in addition to process data such as: Power and force, also process results. These include characteristics such as surface quality, tool wear and the dimensional accuracy of the component.
These process results are crucial for the quality and economy of a produced component. These results are well researched and there are whole books about which parameters and variables have to be combined to get a good and economical result. What has been ignored so far, mostly due to the lack of data availability, is the correlation of the process results and the process data. If this correlation is clear, quality control can already be carried out during machining and the system variables can be adjusted during machining. Tool wear, for example, is significantly influenced by the forces on the tool. If higher forces act on a tool, more power is needed to maintain the specified target data of the NC programme and the tool wears faster or even breaks. Breakage of these tools is One of the main causes of unplanned downtime in industrial environments. In doing so, the Tool breakage 7-20 % of total milling machine downtime, and tooling and tool change costs account for 3-12 % of total machining costs. One hour of downtime can be well 15.000€ costwhich, scaled to 70 machines and only one hour of downtime per year, can already result in costs of over € 1,000,000. It is therefore of enormous advantage to use the tools as optimally as possible without destroying them and provoking a standstill.
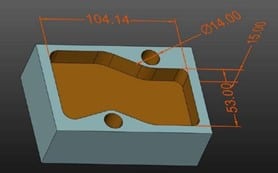
The following example shows where there is potential for optimisation using the existing data. A pocket including two holes is milled in a material block of size 110 x 70 mm to obtain the geometry in Figure 4.
After machining, a quality analysis can be carried out on the component as well as on the milling tool used. This could reveal that the tool has a defect. A process optimiser would now have to carry out several
variables in order to reduce the wear of the tool and to be able to prevent the defect. This can prove to be enormously costly. During the milling process, additional process data is recorded that can already be examined during machining. The combination of the individual axis values enables a 3-dimensional representation in space, which shows the milling paths covered in the process (see Fig. 3).
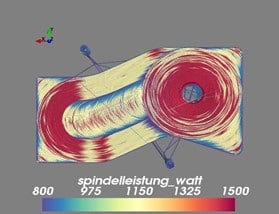
The colouring of the milling paths by the power of the spindle in watts can provide information about where more power was needed for the milling process. Looking at Fig. 3, it can be seen that the spindle has to apply more power as soon as the tool moves a radius. The process optimiser can now use this information to adjust the process, for example by reducing the speed of the spindle in the curves. Of course, it would be even better if the machine itself already knew what was happening and how it had to regulate itself to minimise wear or prevent tool breakage. If a lot of data has already been recorded, machine learning can help predict tool breakage.
Use of machine learning for anomaly detection
This section of the paper shows how automated anomaly detection is possible using spindle power and LSTM (Long Short Term Memory) models.
An LSTM belongs to the RNN (recurrent neural network) networks. Neural networks always consist of individual cells that are modelled on the neurons in the brain. A neuron receives an input signal, can weight it and pass it on to other neurons. If many of these neurons are linked together, a neural network is created.
RNN's are characterised by their ability to process data both forward and backward in a neural network, i.e. from a more recent processing state to an older one. This allows processing in sequences, which makes this type of neural network particularly effective for temporary data or time courses. Information is passed from one step to the next in loops. This allows past information to be linked to current information, which enables the network or model to establish a temporal context. A special type of RNN's are so-called Long Short Term Memory (LSTM) networks. Each LSTM cell has a cell state that can be changed using several functions (Fig. 5).
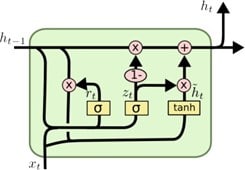
Depending on the function value, it is decided whether a cell information should be retained or forgotten. An LSTM cell tries to remove unimportant information and add important information. In the process, information from past points in time is stored by loops. This makes it particularly useful in time series and can help to view the current values in a larger context.
After training, the LSTM model can predict the spindle power based on the past spindle power and the other machine data. This value is then compared with the actual measured spindle power. A high deviation shows that a different performance would be expected in a normal process and that, for example, a defect on the tool affects the performance. The advantage of this method is that no anomalies are needed to train the model. The normal state of a machine is sufficient for training. This approach is particularly useful in production, where faults (hopefully) occur very rarely. A model with one layer and 256 units was trained.
So 256 neurons in one plane. Feeding this model with the recorded process data such as: Feed rate, speed and the previous spindle power, this enables a prediction of the spindle power for further points in time. Fig. 6 shows the comparison between the predicted power (blue) and the actual power (red). The prediction error is shown in black and grey respectively. This process was completed without damage to the tool and a small amount of wear.
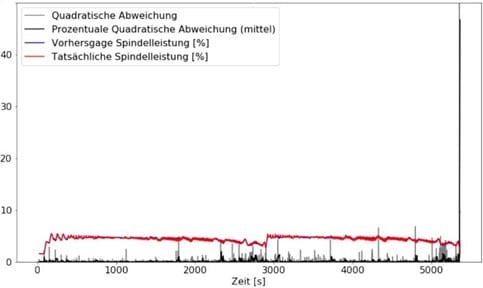
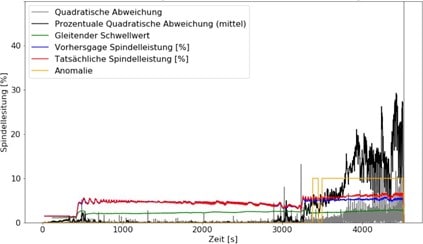
Fig. 7 shows a process in which damage occurred to the tool used during machining. The damaged tool affected the part quality. The process was not finished because the tool broke after 4500 seconds. Here, a clear deviation of the actual spindle power from the predicted power can be seen.
If a threshold value is set that the error may only exceed x times, an anomaly detection can be implemented. The yellow line shows the activation of the anomaly detection. The anomaly was already detected when it occurred and the machine could have been stopped in order to replace the tool and thus prevent the breakage and a longer standstill.
The examples clearly show the potential of the data to enable both the machine operator to monitor the process more closely and implement more targeted optimisations, and to enable the machines themselves to monitor and optimise themselves. So far, we have seen what is possible with data that can already be provided without additional investment. But how high is the potential when even more precise sensor technology, tailored precisely to process monitoring, is linked to the existing data?
The potential of further sensor data
The spindle power is a signal in which many effects can appear, but it is often difficult to classify what kind of anomaly it is on the basis of the spindle power alone. The resolution of the data is also often still too low and the prioritisation of the data export is still too low, because the better and more accurate the process data becomes, the better other anomalies can be detected and even classified. In the second part of this two-part series of blog articles, we will show how additional sensors in the machine can be used to accurately classify a tool condition. For this purpose, high-resolution structure-borne sound data is recorded and images are converted and evaluated with the help of another neural network (CNN), which is used in image recognition, and provides information about the condition of individual cutting edges on the tool.
Are there any unanswered questions? Feel free to contact us via the AT Chatbot?
We would like to thank all the project partners involved as well as the sponsor of the project!


0 Kommentare