
Requirements in data science projects and their precise analysis are of central importance for the success of data-driven projects. These should be complete and free of contradictions. Dealing with requirements is a key success factor in projects. This text presents strategies for optimally determining requirements in data science projects with a visualisation component.
Inhaltsverzeichnis
The more active stakeholders are involved in a project, the greater the challenge to satisfy all of them
Stakeholders are an important factor that determines the Agility of the project and thus helps to determine the success of the project. It can sometimes be demanding to implement all the requirements or wishes of the stakeholders and to respond to them.
This is especially the case when many stakeholders are involved in a project and they have different, possibly even controversial, ideas about the end result. The various strategies that are available in this context are described below using a Visualisation project be acted out.
How can a project manager structure a project to make it a success?
Based on our many years of experience from more than 300 data science projects with a visualisation component, various challenges have emerged and we have developed appropriate procedures and approaches. Strategies established to counter these.
For such decision-making processes regarding the approach, we have developed a decision tree that helps to quickly structure and control the tasks. This starts with the first question regarding existing dashboards, reports or other visualisations that can be provided as orientation.
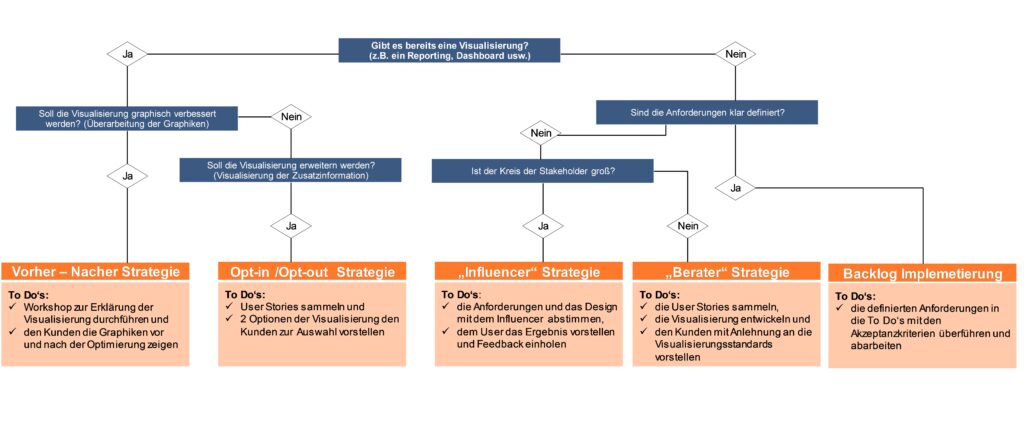
I Before and after strategy
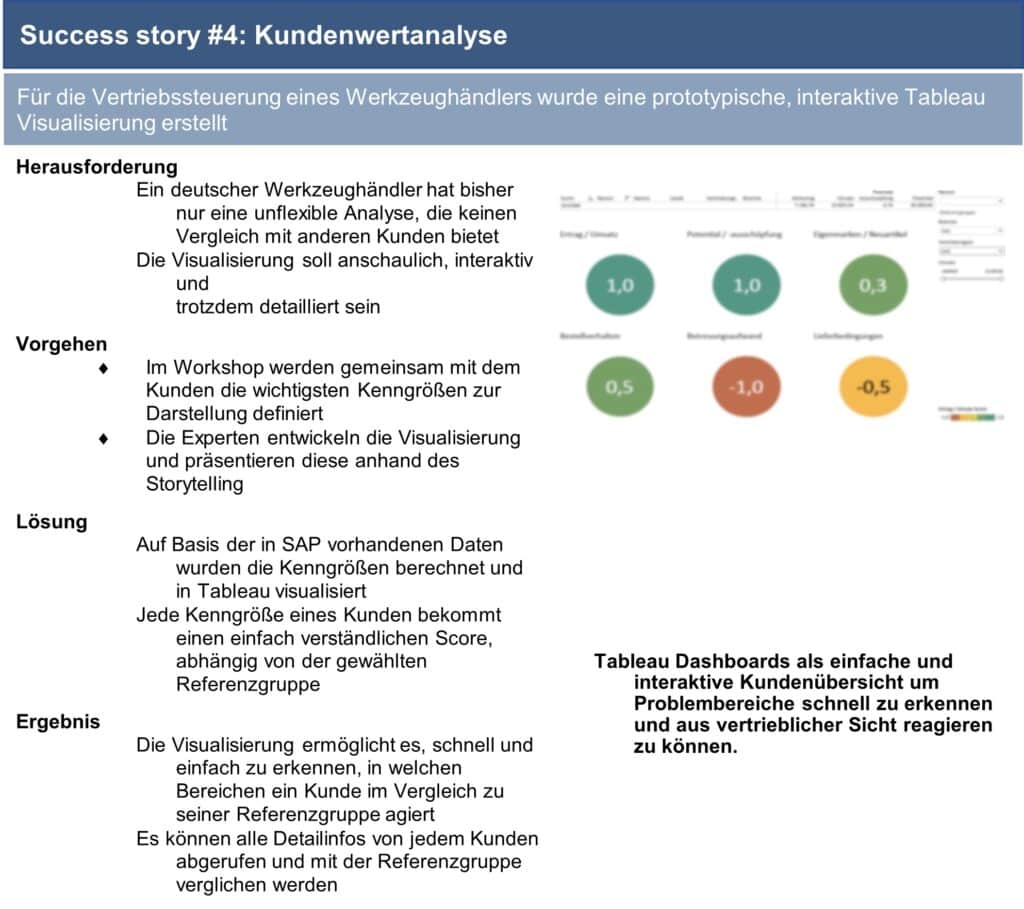
Situation: If a customer already has a visualisation - for example in the form of a reporting, as a PowerPoint or as an application with the dashboards integrated in various technologies such as QlikSense, Qlikview, Tableau, Power BI or similar - it must first be clarified whether this should be optimised or expanded.
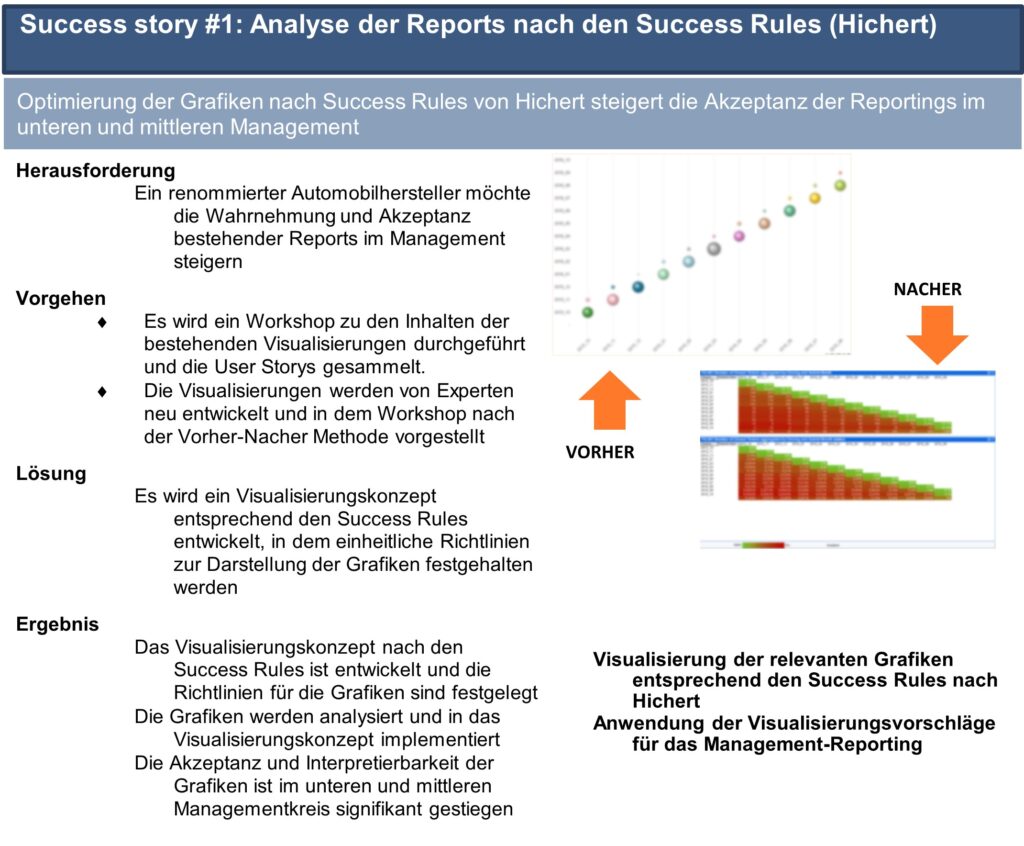
Recommendation: We have established the following procedure for optimisation: We first create a professional understanding for visualisations in a Workshop. In the process, we clarify the purpose and goals as well as all components of the diagrams - including the meanings of the KPIs, dimensions and the exact question that should be answered with the visualisation. Based on this information, the diagrams are methodically developed according to established visualisation standards.
Presentation of results: Finally, we present the results to the clients by comparing the previous variant with the new one. We go into the implemented improvements and present our proposal.
II Opt-In / Opt-Out Strategy
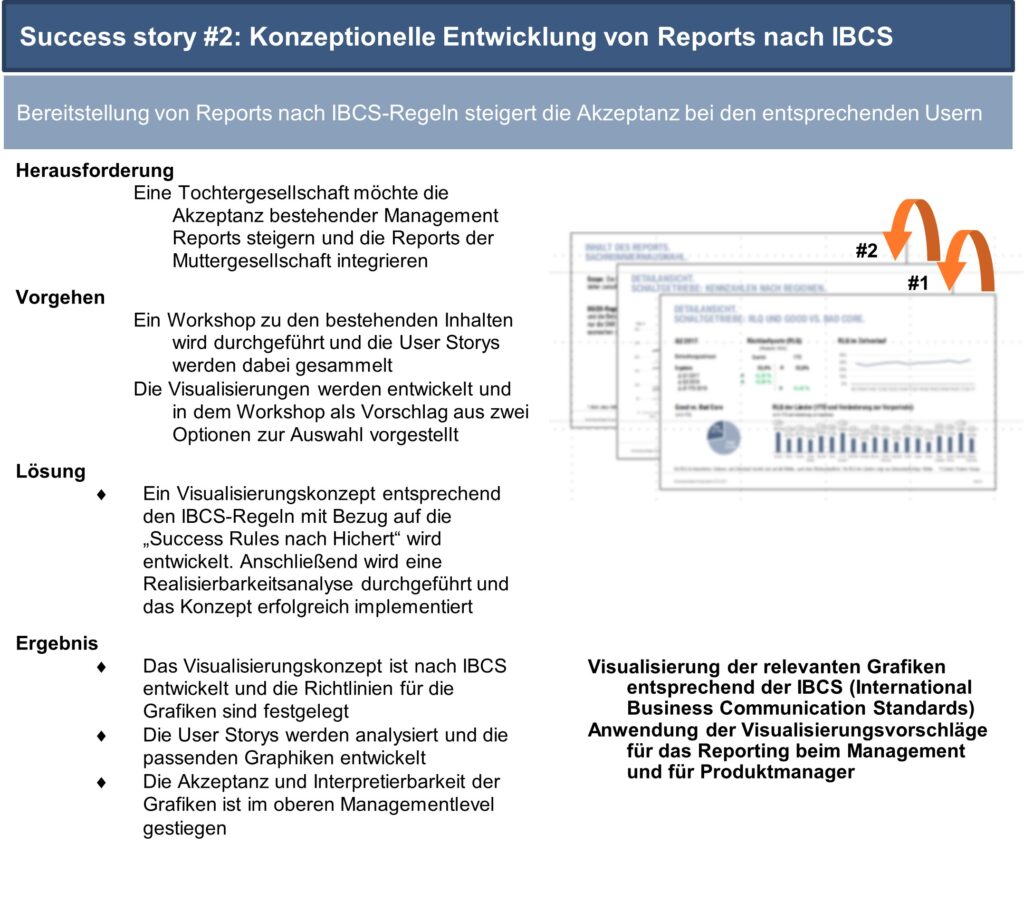
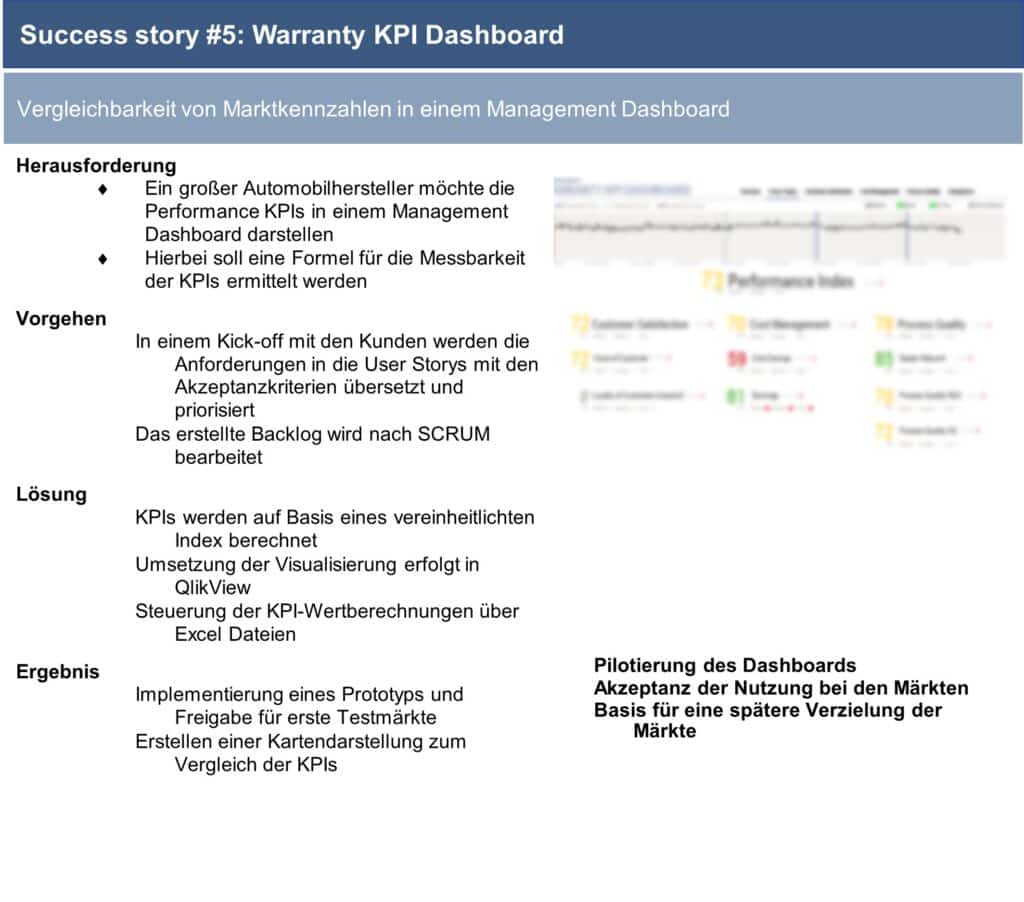
Situation: The situation is different if a visualisation already exists and is to be extended. In this case we recommend the Opt-In / Opt-Out Strategy. First and foremost, we collect user stories in a workshop. These reflect the Workflow of the users and give a good overview of the real customer needs as a basis for the requirements in data science projects.
Recommendation: Based on the information collected, the user stories are converted into visualisations. For each visualisation, an additional Choice alternative developed.
Presentation of results: In an intermediate results workshop, we present the developed graphics with alternatives to the clients. We comment on the advantages and disadvantages of each variant and give our recommendation.
III "Influencer" strategy
Situation: There are cases where our clients start from scratch and have no visualisation basis. The number of Opinion leader is then great, so it is not easy to respond to everyone's wishes and design vision.
Recommendation: One possible solution is to find a stakeholder whose influence on the project is crucial. In the intermediate consultations, the visual developments should then be based on the stakeholder's ideas. This approach is known to us as "Influencer" strategy known.
Presentation of resultsThe results are presented to the entire stakeholder group and discussed in terms of the benefits and innovations gained.
IV "Advisor" strategy
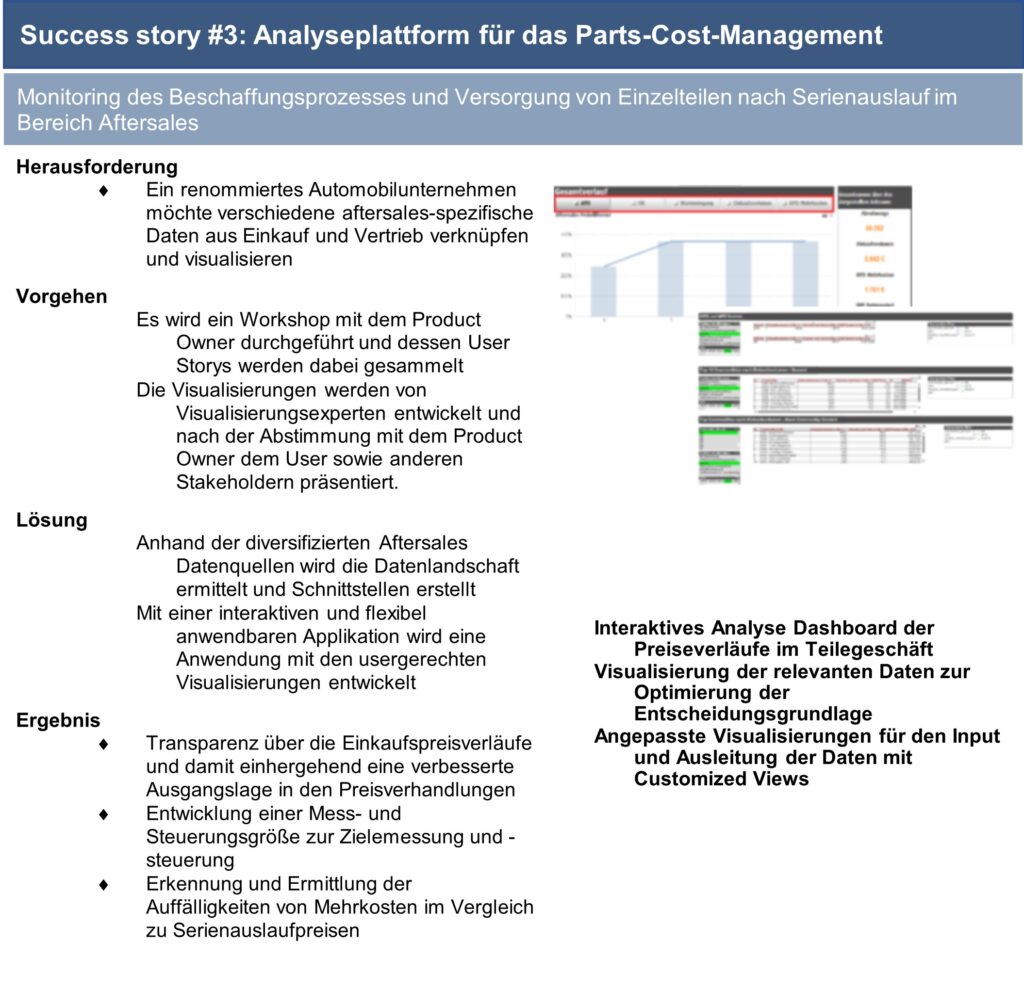
Situation: There are cases where it is not possible to find an influencer and yet several stakeholders need to be served in a project. The exact definition of requirements in data science projects can save a lot of precious time in these situations. Project time cost. The consequences are constant revision and Resource-intensive processes.
Recommendation: For this case, our recommendation is to "Advisor" strategy to track. In the process, all requirements in data science projects with the associated acceptance criteria are collected and prioritised together. The implementation is carried out by the visualisation experts and feedback is recorded during an interim vote. Presentation of results: We present the final version of the visualisations and comment on the methodology used to create the visualisation.
Backlog processing
SituationThe last and simplest approach is backlog processing. When all the requirements in Data science projects are clearly defined, there are no more discussions about them. Thus, a backlog (unfinished tasks in the project) is automatically defined and agreed with the clients.
Recommendation: Process the existing tasks successively in the sprints.
Presentation of resultsIn the final presentation, the requirements in the data science project are referred back to and their implementation is shown. This can happen dynamically in a software or statically in a PowerPoint.
Conclusion
In our experience, these strategies for defining and implementing requirements in data science projects offer comprehensive protection to ensure project success. In doing so, we look back on numerous use cases and correspondingly many experiences from which we have been able to learn.
In particular, the scenarios in which many stakeholders play a role are not only among the most frequent cases, but also among the most demanding. Those who enter the data science project with a strategy for the requirements have already gained a lot before the start.


0 Kommentare