
In 2022 we will celebrate the 10th anniversary of [at] - Alexander Thamm.
In 2012, we were the first consultancy in the German-speaking world to take up the cause of Data & AI. Today, it can be said that artificial intelligence (AI) has the potential to make an important contribution to some of the major economic and social challenges of our time. AI plays a role in the energy transition and in responding to climate change, in autonomous driving, in the detection and treatment of diseases or in pandemic control. AI increases the efficiency of production processes and increases the adaptability of companies to market changes through real-time information as well as predictions.
The economic significance of the technology is increasing rapidly. More than two thirds of German companies now use artificial intelligence and machine learning (ML).
With our #AITOP10 we show you what's hot right now in the field of Data & AI. Our TOP10 lists present podcast highlights, industry-specific AI trends, AI experts, tool recommendations and much more. Here you get a broad cross-section of the Data & AI universe that has been driving us for 10 years now.
Inhaltsverzeichnis
Our Top 10 ML Algorithms - Part 1
Recommender, clustering, regression, text analytics, anomaly detection... Machine Learning can be used today for a variety of problems and is faster and more accurate than ever. But what is it about the algorithms behind it? We take a look behind the scenes and show you which algorithms are really used in machine learning.
Rank 10 - Linear Regression
Linear regression is one of the simplest machine learning (ML) algorithms and is child's play to understand. Example: If you plant a tree, you are doing something good for the environment. Unfortunately, it takes a while for a small seed to grow into a full-grown tree. To document this, the height of the tree is measured every month in our example. This works well for the first two years, but at some point even the tallest cannot reach the top of the tree with the tape measure. Here comes the linear regression Since we have entered the heights already measured in a diagram, we can estimate the future height of the tree relatively accurately at any point in time. If we were able to measure the height the last time a month ago, we draw a straight line through all the points measured so far and extend it a little further. Now, depending on the average deviation, the current tree height for this month can be determined quite accurately.
Linear regression shows the relationship between an independent variable (in this case of time) and a dependent variable (the height of the tree). Often, however, there are several independent variables with the help of which a prediction is to be made. For this purpose the Multiple linear regression. The functional principle remains the same, but several dimensions are used to make a prediction. In our example, this would be the temperature in addition to the time. If the temperature rises, the tree grows faster, if it falls, it grows more slowly.
However, it is important that there is a linear relationship between the independent variables (time, temperature) and the dependent variable (height of the tree). If there is no correlation, linear regression makes no sense and we determine random numbers here. The error rate of the values should be approximately normally distributed. If the values are scattered all over the place, it will be difficult to determine an exact regression line (equalisation line). Finally, the independent values should not be dependent on each other. For example, the hours of sunshine are dependent on the variable temperature and are therefore not suitable for multiple linear regression.
The use of (multiple) linear regression is useful, for example, in forecasting market trends, price developments and risk assessment in the finance and insurance industry.
Rank 9 - Logistic Regression
It is not always necessary to predict a concrete numerical value; often it is also a matter of classifying data. This means the Predicting the category of a variable with the help of given independent variables. Example: Nutrition, sport and health play a major role today. People who eat healthily and do a lot of sport are said to have a longer life, good health and a lower risk of suffering a heart attack. But is that really true?
If I want to predict whether I will have a heart attack within the next 10 years, I can use several values for the prediction: What is my BMI (body mass index)? Do I have any pre-existing conditions? What is my blood pressure? These are all values by which I can more or less accurately describe my health status. Through logistic regression you can predict whether a heart attack is likely in the next 10 years. But how?
First of all, one needs a data set in which all these data are available (BMI, blood pressure, age, previous diseases, blood pressure values). In order to train an ML model, the training data must also contain the information whether a heart attack occurred within the next 10 years. During training, a curve is obtained that determines into which category data can be classified. In contrast to linear regression, logistic regression does not predict numerical values, but classifies data sets into 2 categories: Yes and No, heart attack or no heart attack. If values such as blood pressure, BMI or cholesterol are above or below a certain level, the model claims that the patient will have a heart attack in the next 10 years. But how accurate is this prediction?
The good thing about logistic regression is that a statement can be made about the accuracy of the prediction. Thus, the curve already mentioned determines the boundary: heart attack/no heart attack. In addition, the model determines the probability of the prediction. For example, if the values are close to the boundary, the probability is only just above or below 50%. Conversely, depending on the accuracy of the model, it is just over 0% or just under 100%.
Therefore, logistic regression never provides unambiguous values, only probabilistic values. In practice, this means that a person with a BMI of 50 will suffer a heart attack at 84% within the next 10 years. This value should not be confused with the accuracy of the entire model. This can be increased by including other values that are important for the initial value or by adjusting the model.
The algorithm is used in credit scoring, in medical research and disease prediction or for fraud detection in the financial and insurance industry. Overall, logistic regression is an effective algorithm for very different cases of classification.
Rank 8 - Decision trees
What does Machine Learning have to do with trees? More than you think! To stay with the example: How can you predict whether a tree will bear fruit? With a decision tree.
If you have filled a table with different attributes of trees, you can use it to create a Decision tree create. Starting at the root, at each fork you ask for the value of a tree attribute and then go to the next fork. At the end, the tree gives you the answer 0 or 1, yes or no. For example, at the first fork is the question "Is the tree dead?". If the attribute of the column is "alive" (= no), the prediction is finished: The tree will not bear fruit. The other way round is: "How big is the tree?". If the size of the tree is below a certain threshold, it will not bear fruit and the answer is again "no". If it does, the decision tree continues one fork at a time until the end of the last branch and thus the final prediction "yes" or "no" is made.
Decision trees are used in customer acquisition to identify potential customers or to determine creditworthiness in the financial industry. They are easy to read and interpret and can be applied to non-linear data. Another advantage is that the data is mostly little preparation and clean-up because outliers and missing data have little influence on the prediction accuracy. On the other hand, they are less effective in predicting continuous variables because information is lost by categorising a variable.
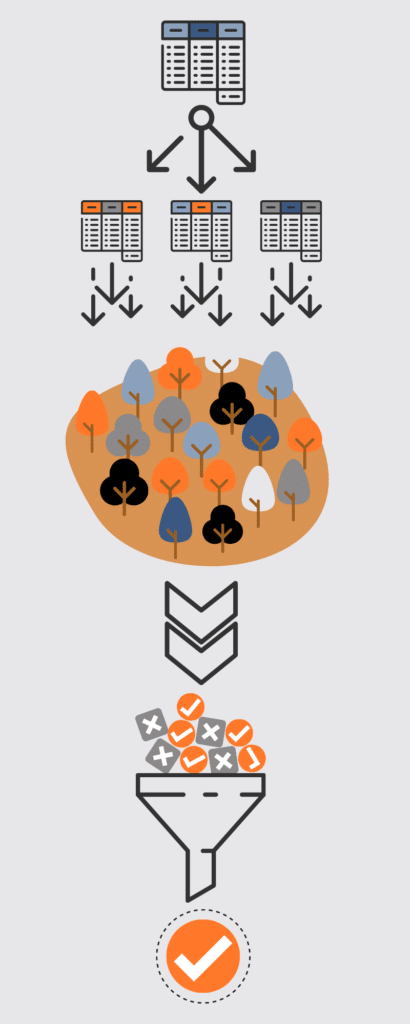
Rank 7 - Random Forest
Especially when making important decisions, people often ask their friends, relatives or colleagues for advice. You rarely limit yourself to one person, but ask several in order to get diverse and perhaps even different answers. The Random Forest Algorithm works in a similar way. The Random Forest Algorithm uses decision trees to - not just one, but a whole forest.
As with an important personal decision, different confidants are familiar with different aspects of the decision. In the Random Forest algorithm, analogously Decision trees with different, newly merged parts of the dataset generated. This is called bagging or bootstrap aggregation. It is important to note that this does not duplicate any decision tree, but rather each represents a different part of the entire data set.
Finally, after consultation, a consensus is reached: with the Random Forest Algorithm, this happens quite democratically. The prediction is generated based on the voting of all decision trees. If 3 vote "yes" and 2 vote "no", the decision is "yes". If the goal of the prediction is not a classification, i.e. a truth value, but a numerical value, the average value of all trees is taken.
The algorithm is used in a wide variety of fields: In the financial sector, Random Forest can be used to identify payment fraud or for credit scoring; in medicine, it can be used to identify diseases based on medical records or predict drug sensitivity. The algorithm can thus for manifold classification and regression problems be used.
Place 6 - K-Means
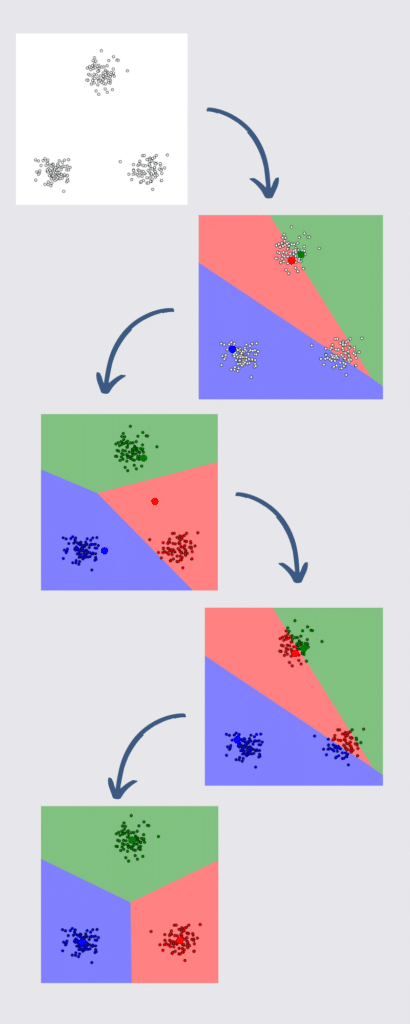
If you want to open a new branch of your pizzeria, you first have to think about where. The Clustering algorithm K-Means is excellent. For example, if you want to expand into a new neighbourhood and open 2 branches there, you can use the existing data on the locations of orders from that neighbourhood to do so. This minimises the delivery routes and later allows predictions about which of the two restaurants a potential customer will go to by location.
First, all data points are plotted on a map and 2 additional data points are placed (for k=2 or 2 branches). Centroid to two random points on the map. Now all the points are assigned to the nearest centroid and placed in a class accordingly. The centroids are then deleted again. Now, on the basis of the "centre of mass", the following is done the centre of all points of a class and thus determine the new centroids. Now it starts all over again: The points are assigned to the closer centroid, classified and the centroids are deleted again. This continues until the position of the centroids no longer changes.
So 2 optimal locations be determined for the new branches. The same can be done with the customers' origin data after the branches have been opened. This makes it possible to predict which branch a customer will order from.
K-Means can be used, for example, to cluster criminal activities. Criminal hotspots can be found on a city map and analysed according to the type of crime most frequently committed. Further on, the algorithm is helpful in identifying fraudulent financial activities or anomaly detection in networks.
That's not all: what is boosting and how can you gain insights from text and images with the help of ML? Read more about this on places 5 to 1 of our Top10 ML algorithms next week.


0 Kommentare