Data Visualization - Consulting & Services
We generate and process unimaginable amounts of data these days. But the true value of data lies not in its quantity, but in its interpretation and use. The larger and more complex the amount of data, the more important visualization becomes to derive valuable insights from it. Complex data visualisation is an integral part of visual analytics - a holistic approach that combines visualisation, human factors and data analysis.
Data visualization - solutions for your business
We see data visualization as the crucial link between people and data. It enables us to understand faster and better what value is hidden in the data. That's why we place great emphasis on user-friendly design, for example when developing a dashboard, and pay attention to a goods UI/UX design. Together with you we develop data visualizations that are not only optical appealing, but above all serve as practical analytical tools for your business.
The advantages of data visualizations are numerous:
- Nbetter understanding through visual analytics
- Naccelerated decision-making processes and increased efficiency
- Nreduction of the complexity of large data sets
- Ntrend detection through forecasts and predictive analyses
- NImproved communication and collaboration

Our Visual Analytics Services
Data visualization courses and trainings
In the data visualization courses and trainings of Alexander Thamm GmbH, we offer a balanced mix of theory and practice that is aimed at both beginners and advanced users. We cover everything from the basics with Data Visualization Fundamentals to specialised courses such as Usability Engineering Training and Data Literacy Training.
Using top tools such as Power BI, Tableau, Qlik and SAP Analytics Cloud, we teach the art of storytelling with data and guide you through the entire dashboard design process. Training can be delivered live, online or as a video-on-demand service tailored to your organisation's needs. Our programmes range from end-user training to specialised executive empowerment training.
Data visualization workshops
Our data visualization workshops, especially the Use Case Workshop, offer an in-depth and interactive introduction to the world of visual analytics, data visualization and storytelling. During these workshops, we focus particularly on requirements gathering for dashboard and report development, with an emphasis on hands-on exercises and the development of specific use scenarios.
The aim is not only to teach participants the techniques for creating dynamic dashboards, but also to give them the skills to visualize complex data structures and realise transformative storytelling with data.
Development of dashboards for data visualization
Alexander Thamm GmbH uses its experience in data analysis and real-time data visualization to support companies not only in the field of business intelligence, but also in the development of maintenance dashboards in the industry.
Our approach covers everything from basic dashboard redevelopment to advanced methods such as wireframing, mockups, click dummies and prototyping. With a balanced mix of cutting-edge visualization techniques and user-centric design, we offer tool-independent visualization solutions, including the use of technologies such as R Shiny, Python and JavaScript. Our main goal is to provide executives with a powerful tool that enables deep analytics and facilitates the transition to data-driven insights.
Advanced Reporting
By combining state-of-the-art analytics, precise data modelling and optimised data solutions, we create reports that bring clarity to complex scenarios. With a focus on ground-up report development and integration of scaling data platforms, including comprehensive rights and role concepts, we ensure the highest data quality in our reports. The result is clear, detailed and meaningful reports that support informed decisions and facilitate strategic directions.
Migration of existing dashboards and reporting
When migrating existing dashboards and reporting (e.g. Qlik to Power BI), Alexander Thamm GmbH supports your company in seamlessly transitioning to more modern and efficient data visualization solutions. Taking into account the technical, semantic and design aspects of your existing systems, we ensure smooth integration into current platforms.
The goal is to ensure the longevity of your complex data visualizations while increasing their effectiveness and giving you tools that meet today's data analysis and interpretation requirements.
User Experience & User Interface Analysis and Testing
With support in requirements gathering and through usability testing of existing dashboards, based on state-of-the-art UX/UI methods and tools, we identify strengths, weaknesses and potentials in your applications. The primary goal is to create an intuitive, engaging and efficient user experience that not only meets but exceeds end-user requirements, with particular emphasis on optimising the human-technology interface.
Your data visualization experts

Elena Danchyshyna
Data Visualization Engineer | Alexander Thamm GmbH

Josephine Gehlhar
Data Visualization Engineer | Alexander Thamm GmbH

Alena Beyer
Data Visualization Engineer | Alexander Thamm GmbH
Customer references

System for vehicle registration
for an automotive group

Basic training in data visualization
for a pharmaceutical company

Reporting according to IBCS
for a car manufacturer

Dashboard design
for an automotive group
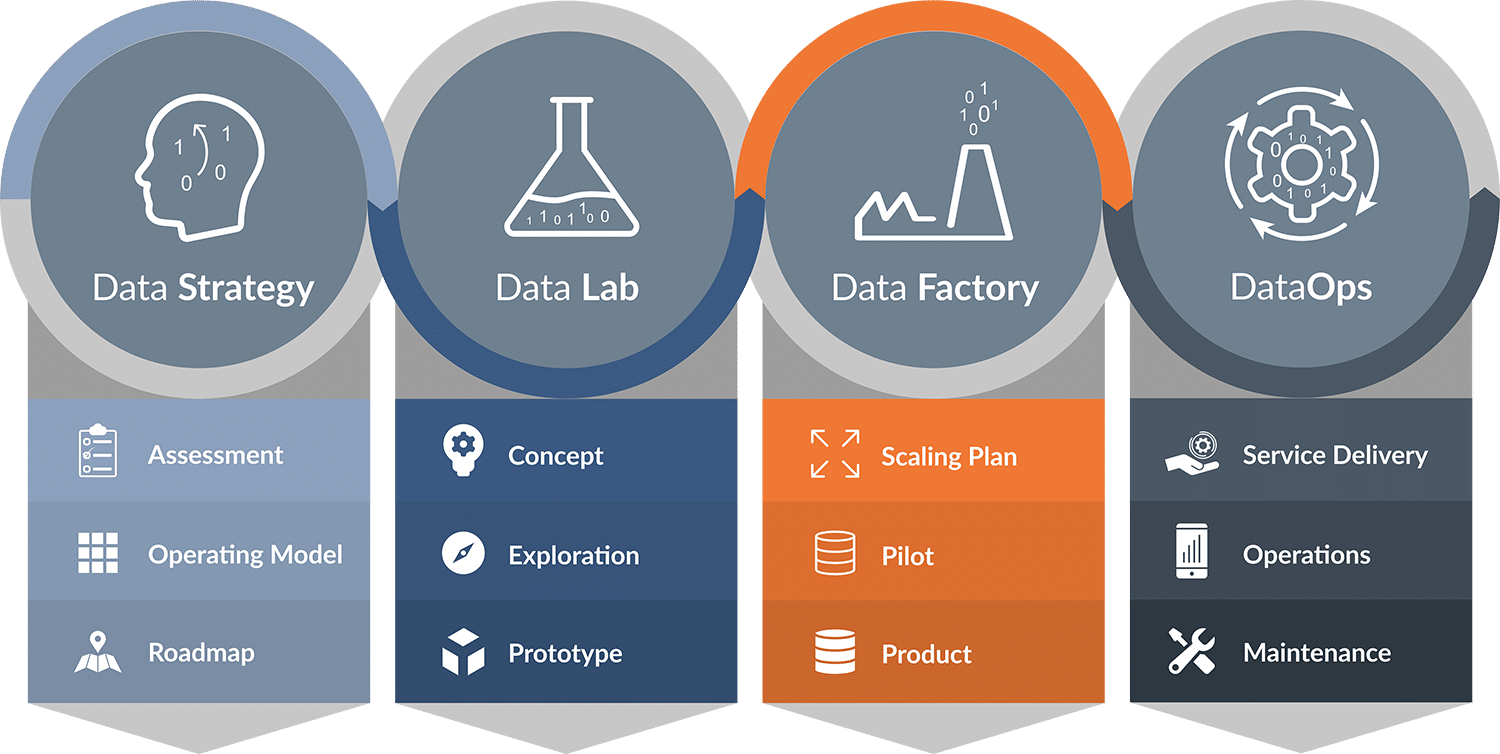
Our methodology: the [at] Data Journey
Today, much of the business value is based on the analysis of data. The crucial question is how do we generate value from data to turn problems into concrete solutions?
With the Data Journey we have developed a holistic system for Data & AI projects, with which we can determine the starting position and Taking a holistic view of our customers' problemsin order to be able to offer them the best possible advice and the best possible solutions:
From comprehensive consulting and development of a data strategy, through proof of concept and prototypes, to the finished product and subsequent continuous maintenance and optimisation.
Further services
Data Science Consulting
Data strategy consulting
MLOps Consulting & Services
Data Platform Services
Keynote speaker
Generative AI Workshops
Resources
Informative blog content, inspiring webinars, entertaining videos and engaging podcasts: valuable subject content for further in-depth study.

4 Strategies for data visualization
Identify requirements for Data Viz projects

Data visualizations
Rules, Approaches & Requirements